Compressor Lubrication Best Practices
A
compressor is a type of machine that elevates the pressure of a
compressible process fluid, typically air, or a host of other gases.
Dynamic compressors are based on the principle of imparting velocity to a
gas stream and then converting this velocity energy into pressure
energy. In contrast, positive displacement compressors confine a certain
inlet volume of gas in a given space and subsequently elevate this
trapped amount of gas to some higher pressure level. The overwhelming
majority of compressors in either the dynamic (axial/centrifugal) or
positive displacement (reciprocating and screw-type) category
incorporate moving components.
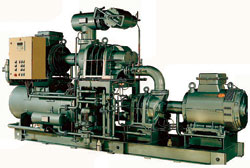
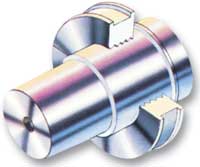
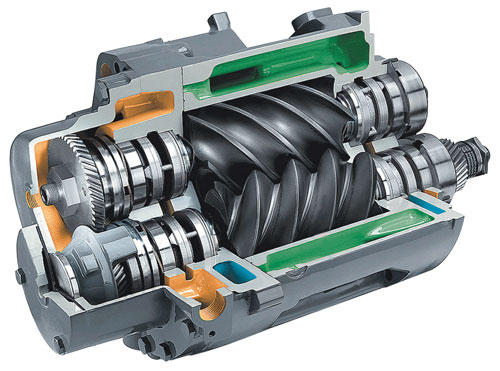
Nearly all compressors require a form of lubricant to either cool, seal or lubricate internal components. Only static jet compressors (ejectors) and late 20th- and early 21st-century oil-free machines with rotors suspended in magnetic or air bearings are exempt from the need for some type of lubrication. This article deals with the lubrication of dynamic compressors (Figure 1).
Key Components
Dynamic compressors have a few key components that require a coolant/lubricant: gears, bearings and seals. To date, the majority of dynamic compressors continue to utilize oil film-lubricated seals, as illustrated in Figures 2d, 3a and 3b. Only labyrinth seals (Figures 2a and 2b) or gas-lubricated seals (Figure 3c) operate without a liquid film separating the faces. On the more conventional liquid- lubricated seals, the bearing and sealing lubricant are often the same.
Figure 3a
Figure 3b
Figure 3c
The lube oil system (Figure 4) supplies oil to the compressor and driver bearings and to the gears and couplings. The lube oil is drawn from the reservoir by the pumps and is fed under pressure through coolers and filters to the bearings. Upon leaving the bearings, the oil drains back to the reservoir.
The
reservoir is designed to permit circulation of its entire fluid volume
between eight to 12 times per hour. Oil reservoirs often have thermal
sensors for monitoring temperature levels during start-up and constant
operations.
Reservoirs also often have oil temperature controls that provide for preheating during cold start-up conditions and cooling to prevent overheating during peak operating cycles. The reservoir may be pressurized or vented.
When in operation, the compressor lubricant oil is normally circulated by the main oil pump. An auxiliary pump serves as a standby. These two pumps generally have different types of drive or power sources. When both are driven electrically, they are connected to separate supply feeders. On compressors with step-up gearboxes, the main oil pump may be driven mechanically from the gearbox, and the auxiliary pump operates during the start-up and run-down phases of the compressor train. Relief valves protect both pumps from the effects of excessively high pressures. Check-valves prevent reverse flow of oil through the stationary pump.
Heat generated by friction in the bearings is transferred to the cooling medium in the oil coolers. Air-cooled oil coolers may be employed as an alternative to water-cooled oil coolers. The former have long been used in regions where water is in short supply. A pressure-regulating valve is controlled by the pressure downstream of the filters and maintains constant oil pressure by regulating the quantity of bypassed oil.
A pressure switch activates the auxiliary oil pump. If the oil pressure falls below a preset limit, a second pressure switch shuts down the compressor train. Filters clean the lube oil before it reaches the lubrication points and a differential pressure gauge monitors the degree of fouling (flow restriction) of the filters.
The flow of oil to each bearing is regulated individually by orifices, particularly important for lubrication points requiring different pressures. Lube oil for the driver and other mechanical components is taken from branch lines. For instance, when a hydraulic shaft position indicator is used, it is supplied with oil from the lube oil system.
Temperatures and pressures are measured at all important locations in the system, including temperatures from oil sumps, return lines from bearings, gears and other mechanical components. Temperatures and pressures are often recorded on the suction and discharge sides of each compression stage to offer the operator a sense of the health of the system. The readings can be taken locally or transmitted to a monitoring station.
Compressor Seals
In general, the mechanical contact or oil face seal (Figure 3a) employs a spring-loaded stationary carbon ring in sliding contact with a rotating ring manufactured from high-quality material with a special finish. This type of seal is also effective when the compressor is at standstill and the oil pumps have been shut down.
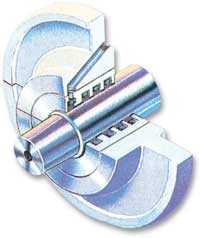
The main components of oil bushing seals (Figure 3b) are two stationary, but radially free-to-move (floating ring) breakdown bushings with small diametral clearances opposite a shaft sleeve (Figure 3b). The floating ring clearance controls the flow of the seal liquid cooling the seal.
Floating carbon ring seals (not shown) successfully combine some of the best features of all of the above. They, too, require seal face lubrication.
Seal Oil System Operations
The seal oil, or seal liquid system (Figure 5) supplies the mechanical contact and floating ring seals with an adequate flow of seal liquid at all times, correctly ensuring proper function. An effective seal is provided at the settle-out pressure when the compressor is not running. The seal oil system may be combined with the lube oil system if the gas does not adversely affect the lubricating qualities of the oil, or provided the oil made unserviceable by the gas does not return into the oil system.
There are
two methods of combining lube oil and seal oil systems: booster or
combined systems. In the booster system, the oil pressure is raised to
the pressure required for lubrication purposes and then part of it is
raised further to the pressure needed for sealing. Alternatively, in the
combined system, all the oil is initially raised to the required
pressure and flow, then reduced to system component requirements.
The hardware and operation of each of these types of oil systems are identical or nearly identical. Mechanical face seals and floating ring seals are supplied with seal oil at a defined differential pressure above the reference gas pressure (pressure within the inner seal drain). The flow of seal oil is regulated by a differential pressure-regulating valve, which changes the pressure of the seal oil relative to changes in system gas pressure or, as shown in Figure 5, by a level-control valve that maintains a constant level in the overhead tank.
The oil in the overhead tank is in contact with the reference gas pressure via a separate line, with a static head providing the required pressure differential. In addition, the oil in the overhead tank compensates for pressure fluctuations and serves as a rundown supply if pressure is lost. If the level in the tank falls excessively, a level switch shuts down the compressor. A moderate oil temperature is maintained by a constant flow of oil through the overhead tank.
For the mechanical contact seal system, a regulating valve maintains the reference gas and the seal oil at a constant differential pressure. As the name indicates, the mechanical contact seal serves as a mechanical standstill seal when the compressor plant is shut down.
The seal oil is split into two streams in the compressor seals. Most of the flow returns under gravity to the reservoir. A small quantity passes through the inner seal ring to the inner drain, where it is exposed to the gas pressure.
This oil, mixed with the buffer gas, flows to the separator system, which consists of a separator and a condensate trap on each side. The separated gas flows to either the flare stack or to the suction side of the compressor while the oil flows into a tank for further degassing.
If oil is used as sealing liquid and can be used again, degassing is accelerated by heating or by air or nitrogen sparging. Sparging units perform on-stream purification of oil which can keep lubricants serviceable for long time periods. Only if the oil becomes unusable is it led away for separate treatment or disposal. The quantity of oil passing through the inner drain in a modern centrifugal compressors is small and ranges from 5 to 50 liters per day on new machines.
Compressor Lubricants
The overwhelming majority of compressors are best served by premium-grade turbine oils with ISO viscosity grades of 32 or 46. However, there are many different types of compressors and each manufacturer is likely to recommend lubricants that have been used on a test stand and at controlled user facilities.
Premium-grade ISO VG 32 turbine oils are used more often than the heavier viscosity grades. The typical viscosity index is 97, with a pour point around -37ºC (-35ºF). Oxidation stability (per ASTM D943) should exceed 5,000 hours and the flash point (per ASTM D92, COC) should be 206ºC, or 403ºF. These lubricants must provide the following:
Extended lifecycles on turbine, turbo-compressor and other R&O type oils used in these applications are also facilitated by the relatively simple additive structure of the product, which minimizes kinds of complications associated with complex additive systems like those found in EP gear lubricants.
Editor’s Note
Condensed, by permission, from ISBN 0-88173-296-6, Bloch, Heinz P. Practical Lubrication for Industrial Facilities. Lilburn, Ga: The Fairmont Press, 2000.
Nearly all compressors require a form of lubricant to either cool, seal or lubricate internal components. Only static jet compressors (ejectors) and late 20th- and early 21st-century oil-free machines with rotors suspended in magnetic or air bearings are exempt from the need for some type of lubrication. This article deals with the lubrication of dynamic compressors (Figure 1).
Dynamic compressors have a few key components that require a coolant/lubricant: gears, bearings and seals. To date, the majority of dynamic compressors continue to utilize oil film-lubricated seals, as illustrated in Figures 2d, 3a and 3b. Only labyrinth seals (Figures 2a and 2b) or gas-lubricated seals (Figure 3c) operate without a liquid film separating the faces. On the more conventional liquid- lubricated seals, the bearing and sealing lubricant are often the same.
 |
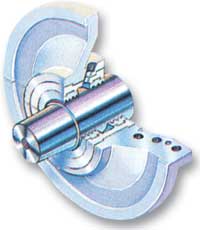 |
Figure 2a
|
Figure 2b
|
 |
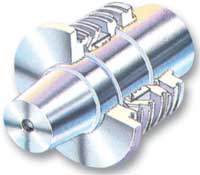 |
Figure 2c
|
Figure 2d
|
Figure 2. Traditional Compressor Seal Designs
(Dresser-Roots Co., Connersville, IN) |
|
Figure 3a
Figure 3b
Figure 3c
Figure 3. Modern Compressor Seal Configurations
(Demag-DeLaval, Trenton, NJ)
Lubricating Oil System Operation (Demag-DeLaval, Trenton, NJ)
The lube oil system (Figure 4) supplies oil to the compressor and driver bearings and to the gears and couplings. The lube oil is drawn from the reservoir by the pumps and is fed under pressure through coolers and filters to the bearings. Upon leaving the bearings, the oil drains back to the reservoir.
Reservoirs also often have oil temperature controls that provide for preheating during cold start-up conditions and cooling to prevent overheating during peak operating cycles. The reservoir may be pressurized or vented.
When in operation, the compressor lubricant oil is normally circulated by the main oil pump. An auxiliary pump serves as a standby. These two pumps generally have different types of drive or power sources. When both are driven electrically, they are connected to separate supply feeders. On compressors with step-up gearboxes, the main oil pump may be driven mechanically from the gearbox, and the auxiliary pump operates during the start-up and run-down phases of the compressor train. Relief valves protect both pumps from the effects of excessively high pressures. Check-valves prevent reverse flow of oil through the stationary pump.
Heat generated by friction in the bearings is transferred to the cooling medium in the oil coolers. Air-cooled oil coolers may be employed as an alternative to water-cooled oil coolers. The former have long been used in regions where water is in short supply. A pressure-regulating valve is controlled by the pressure downstream of the filters and maintains constant oil pressure by regulating the quantity of bypassed oil.
A pressure switch activates the auxiliary oil pump. If the oil pressure falls below a preset limit, a second pressure switch shuts down the compressor train. Filters clean the lube oil before it reaches the lubrication points and a differential pressure gauge monitors the degree of fouling (flow restriction) of the filters.
The flow of oil to each bearing is regulated individually by orifices, particularly important for lubrication points requiring different pressures. Lube oil for the driver and other mechanical components is taken from branch lines. For instance, when a hydraulic shaft position indicator is used, it is supplied with oil from the lube oil system.
Temperatures and pressures are measured at all important locations in the system, including temperatures from oil sumps, return lines from bearings, gears and other mechanical components. Temperatures and pressures are often recorded on the suction and discharge sides of each compression stage to offer the operator a sense of the health of the system. The readings can be taken locally or transmitted to a monitoring station.
Compressor Seals
In general, the mechanical contact or oil face seal (Figure 3a) employs a spring-loaded stationary carbon ring in sliding contact with a rotating ring manufactured from high-quality material with a special finish. This type of seal is also effective when the compressor is at standstill and the oil pumps have been shut down.
The main components of oil bushing seals (Figure 3b) are two stationary, but radially free-to-move (floating ring) breakdown bushings with small diametral clearances opposite a shaft sleeve (Figure 3b). The floating ring clearance controls the flow of the seal liquid cooling the seal.
Floating carbon ring seals (not shown) successfully combine some of the best features of all of the above. They, too, require seal face lubrication.
Seal Oil System Operations
The seal oil, or seal liquid system (Figure 5) supplies the mechanical contact and floating ring seals with an adequate flow of seal liquid at all times, correctly ensuring proper function. An effective seal is provided at the settle-out pressure when the compressor is not running. The seal oil system may be combined with the lube oil system if the gas does not adversely affect the lubricating qualities of the oil, or provided the oil made unserviceable by the gas does not return into the oil system.
The hardware and operation of each of these types of oil systems are identical or nearly identical. Mechanical face seals and floating ring seals are supplied with seal oil at a defined differential pressure above the reference gas pressure (pressure within the inner seal drain). The flow of seal oil is regulated by a differential pressure-regulating valve, which changes the pressure of the seal oil relative to changes in system gas pressure or, as shown in Figure 5, by a level-control valve that maintains a constant level in the overhead tank.
The oil in the overhead tank is in contact with the reference gas pressure via a separate line, with a static head providing the required pressure differential. In addition, the oil in the overhead tank compensates for pressure fluctuations and serves as a rundown supply if pressure is lost. If the level in the tank falls excessively, a level switch shuts down the compressor. A moderate oil temperature is maintained by a constant flow of oil through the overhead tank.
For the mechanical contact seal system, a regulating valve maintains the reference gas and the seal oil at a constant differential pressure. As the name indicates, the mechanical contact seal serves as a mechanical standstill seal when the compressor plant is shut down.
The seal oil is split into two streams in the compressor seals. Most of the flow returns under gravity to the reservoir. A small quantity passes through the inner seal ring to the inner drain, where it is exposed to the gas pressure.
This oil, mixed with the buffer gas, flows to the separator system, which consists of a separator and a condensate trap on each side. The separated gas flows to either the flare stack or to the suction side of the compressor while the oil flows into a tank for further degassing.
If oil is used as sealing liquid and can be used again, degassing is accelerated by heating or by air or nitrogen sparging. Sparging units perform on-stream purification of oil which can keep lubricants serviceable for long time periods. Only if the oil becomes unusable is it led away for separate treatment or disposal. The quantity of oil passing through the inner drain in a modern centrifugal compressors is small and ranges from 5 to 50 liters per day on new machines.
Compressor Lubricants
The overwhelming majority of compressors are best served by premium-grade turbine oils with ISO viscosity grades of 32 or 46. However, there are many different types of compressors and each manufacturer is likely to recommend lubricants that have been used on a test stand and at controlled user facilities.
Premium-grade ISO VG 32 turbine oils are used more often than the heavier viscosity grades. The typical viscosity index is 97, with a pour point around -37ºC (-35ºF). Oxidation stability (per ASTM D943) should exceed 5,000 hours and the flash point (per ASTM D92, COC) should be 206ºC, or 403ºF. These lubricants must provide the following:
- Long life without need for changeout
- Prevention of acidity, sludge, deposit formation
- Excellent protection against rust and corrosion, even during shutdown
- Good demulsibility to shed water that enters the lubrication system
- Easy filterability without additive depletion
- Good foam control
Extended lifecycles on turbine, turbo-compressor and other R&O type oils used in these applications are also facilitated by the relatively simple additive structure of the product, which minimizes kinds of complications associated with complex additive systems like those found in EP gear lubricants.
Editor’s Note
Condensed, by permission, from ISBN 0-88173-296-6, Bloch, Heinz P. Practical Lubrication for Industrial Facilities. Lilburn, Ga: The Fairmont Press, 2000.
 It’s
not just the cost of lost production either. A compressor failure in a
single part of the refinery can cost tens of thousands of dollars a day
in lost revenue, with similar amounts to rebuild a compressor, and
hundreds of thousands of dollars for a replacement. There’s also the
cost of maintaining spares.
It’s
not just the cost of lost production either. A compressor failure in a
single part of the refinery can cost tens of thousands of dollars a day
in lost revenue, with similar amounts to rebuild a compressor, and
hundreds of thousands of dollars for a replacement. There’s also the
cost of maintaining spares.
 The
outdoor pollution alone kills 1.09 lakh adults and 7,513 children every
year in India, while about six per cent (nearly Rs 3.75 lakh crore) of
the country’s gross domestic product (GDP) is getting lost due to a
ruining environment. The numbers were flagged in the recently released
World Bank study that was commissioned by the central government.
The
outdoor pollution alone kills 1.09 lakh adults and 7,513 children every
year in India, while about six per cent (nearly Rs 3.75 lakh crore) of
the country’s gross domestic product (GDP) is getting lost due to a
ruining environment. The numbers were flagged in the recently released
World Bank study that was commissioned by the central government.